Data analysis/pt: Difference between revisions
Updating to match new version of source page |
Created page with "<div style="float:right; margin: 0px 0px 0px 0px"> <graphviz border='frame' format='svg'> digraph FunctionalitiesDiagram { node [shape="oval" style=filled fillcolor="orange" fontsize="9pt"]; //----- Gráfico de análise de dados // Nodes Análise de Dados [rótulo="Análise de Dados"]; Indicadores Globais [label="Indicadores Globais" shape=tab URL="#Indicadores_Globais" ]; TestsPerLaboratoryArea [label="Testes por área de laboratório" shape=tab URL="#Testes_por_área_d..." |
||
| Line 4: | Line 4: | ||
Ele basicamente permite que o supervisor do laboratório acompanhe o número de testes realizados (potencialmente agrupados) e alguns elementos básicos relacionados às solicitações. | Ele basicamente permite que o supervisor do laboratório acompanhe o número de testes realizados (potencialmente agrupados) e alguns elementos básicos relacionados às solicitações. | ||
<div style="float:right; margin: 0px 0px 0px 0px"> | <div style="float:right; margin: 0px 0px 0px 0px"> | ||
<graphviz border='frame' format='svg'> | <graphviz border='frame' format='svg'> | ||
digraph FunctionalitiesDiagram { | digraph FunctionalitiesDiagram { | ||
node [shape="oval" style=filled fillcolor="orange" fontsize="9pt"]; | |||
//----- Gráfico de análise de dados | |||
// Nodes | |||
Análise de Dados [rótulo="Análise de Dados"]; | |||
Indicadores Globais [label="Indicadores Globais" shape=tab URL="#Indicadores_Globais" ]; | |||
TestsPerLaboratoryArea [label="Testes por área de laboratório" shape=tab URL="#Testes_por_área_de_laboratório"]; | |||
TestsPerKind [label="Testes por tipo" shape=tab URL="#Tests_per_kind"]; | |||
TestsPerGender [label="Testes por gênero" shape=tab URL="#Tests_per_gender"]; | |||
// Edges | |||
Análise de Dados -> Indicadores Globais; | |||
Análise de Dados -> TestsPerLaboratoryArea; | |||
Análise de Dados -> TestesPorTipo; | |||
Análise de Dados -> TestsPerGender; | |||
} | } | ||
</graphviz> | </graphviz> | ||
</div> | </div> | ||
__TOC__ | __TOC__ | ||
<div lang="en" dir="ltr" class="mw-content-ltr"> | <div lang="en" dir="ltr" class="mw-content-ltr"> | ||
Revision as of 00:53, 20 May 2025
Fornece uma funcionalidade analítica muito básica baseada em contadores. Ele basicamente permite que o supervisor do laboratório acompanhe o número de testes realizados (potencialmente agrupados) e alguns elementos básicos relacionados às solicitações.

Database queries

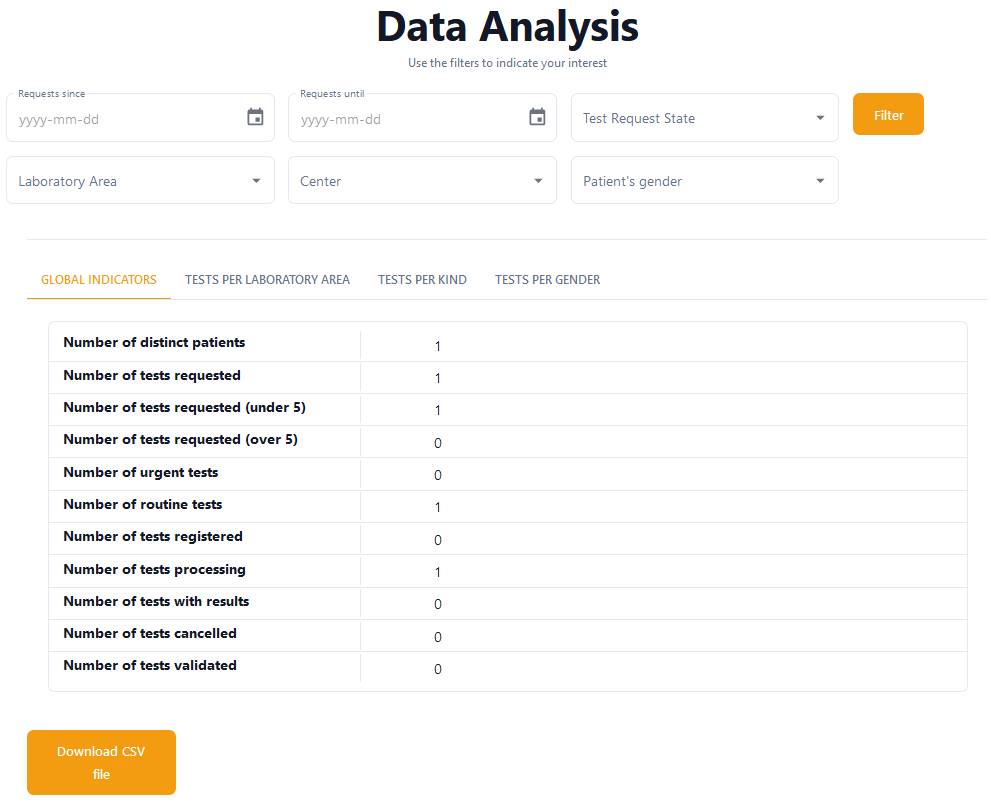
This form contains a filter at the top of the screen, which allows the laboratory supervisor to choose the parameter for the database search. There are nine filter fields available, at most (only those being used in the existing requests are shown).
- From (request's creation date): the data taken will only contain requests created after this date.
- Until (request's creation date): the data taken will only contain requests created before this date.
- Test request state
- Laboratory area
- Requesting centre
- Requesting unit
- Patient's gender
- Patient's provenance region
- Patient's provenance location
Not all filters are always visible. If the ARIS database does not contain values for a specific element, the filter for this element will not be shown to the laboratory supervisor.
Global indicators
This tab contains a table with counters, which shows the laboratory supervisor the number of certain elements that are in the ARIS database.
Tests per laboratory area
This tab groups together all the tests that belong to each laboratory area and shows the laboratory supervisor the number of each one.
At the bottom left of this tab, there is a download button. When clicked, this button will download every piece of information found in the screen into the laboratory supervisor's computer.
Tests per kind
This tab groups together all the kinds of tests and shows the laboratory supervisor the number of each one. It also informs the laboratory supervisor as to which laboratory area each kind of test belongs to.
At the bottom left of this tab, there is a download button. When clicked, this button will download every piece of information found in the screen into the laboratory supervisor's computer.
Tests per gender
This tab groups together all the tests that belong to each gender and shows the laboratory supervisor the number of each one.
At the bottom left of this tab, there is a download button. When clicked, this button will download every piece of information found in the screen into the laboratory supervisor's computer.